This is more than just a pet peeve. In many papers I review (I won’t attempt to blindly guess what fraction, but it’s high!), authors plot ratios of terms poorly. Let’s say you want to know the relative importance of the magnitude of longwave radiative cooling of a cloud top to the shortwave radiative warming. A reasonable way to assess such a thing would be to take their ratio and plot it up (over space or time or whatever). The common way (and I will argue the wrong way) one might visualize this is to plot up the ratio on a linear scale.
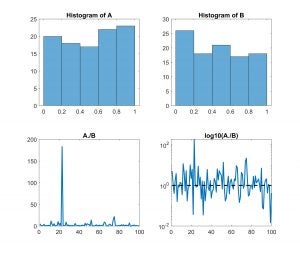
I’ve plotted up some synthetic data below. A and B are MATLAB vectors initialized with 100 random numbers between 0 and 1. The histograms of A and B are shown in the top row below. They’re nearly uniformly distributed. Now if I want to know something about the ratio of A to B, I might plot it up like I did on the bottom left. And, I might ask what the mean ratio is. It’s 4.3. This combination of information might lead me to conclude that the ratio is characterized by something greater than 1. Seems reasonable. But remember, I have two randomly initialized vectors; I would expect their properties to be about the same. I’m more likely to appreciate that with the figure on the bottom right. By taking the log, I give equal voice to things less than 1 and greater than 1. Excursions above the dashed line (at 1) and below occur with about the same frequency and magnitude. The mean of log10(A./B) is 0.06; When I raise 10 to that power (i.e. 10^0.06), I realize that my average ratio is better characterized by 1.1 (Or, about even odds of my random variables being greater or less than one another).
I’m getting tired of harping on this in reviews.