![]()
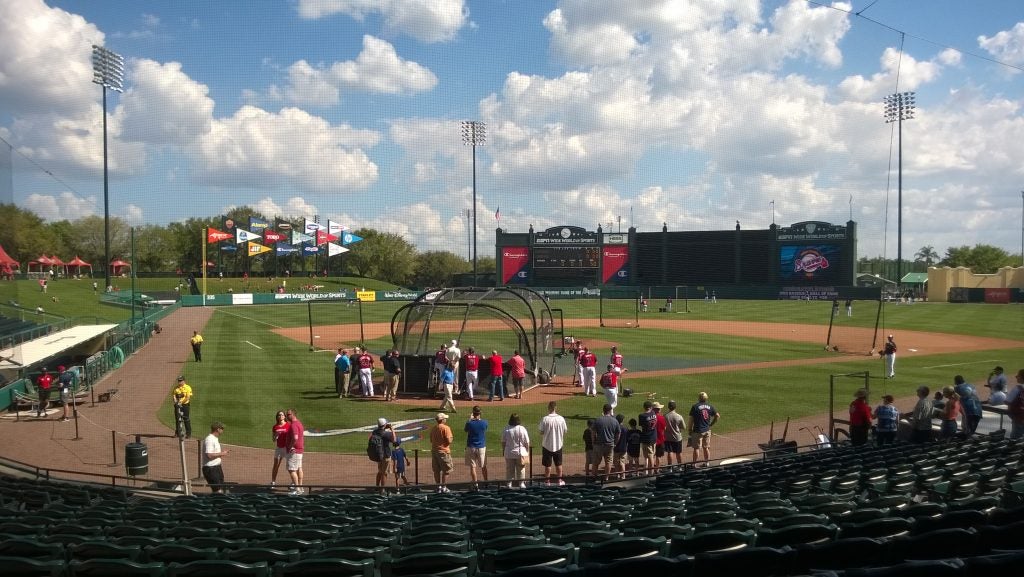
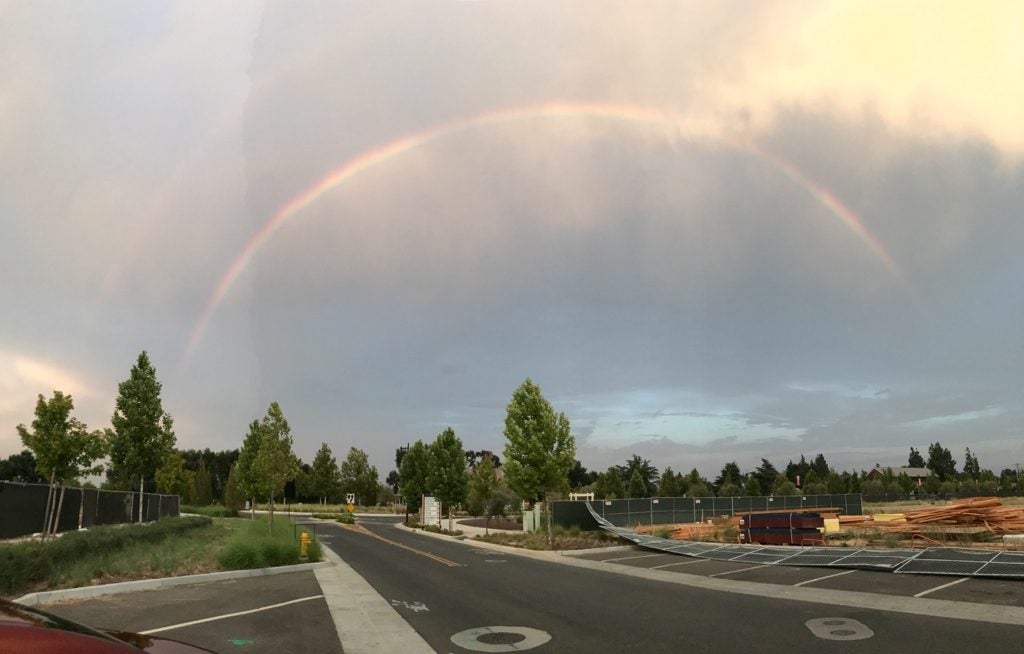
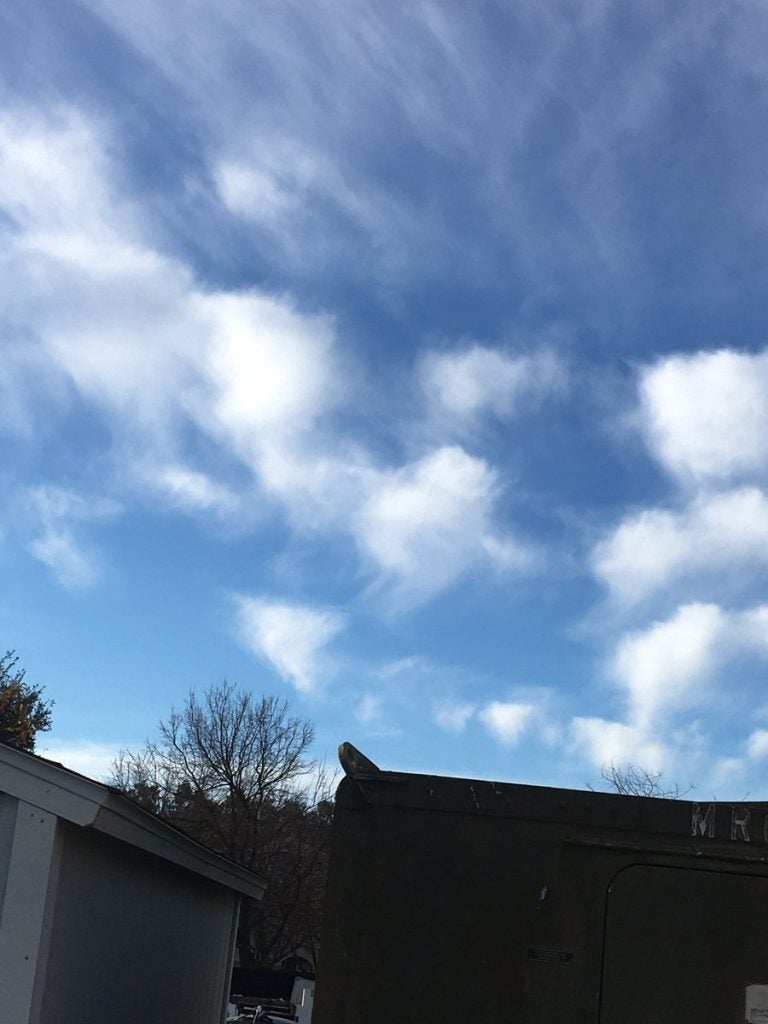
*We’ve missed you in your absence.
Convective Atmosphere Group
![]()
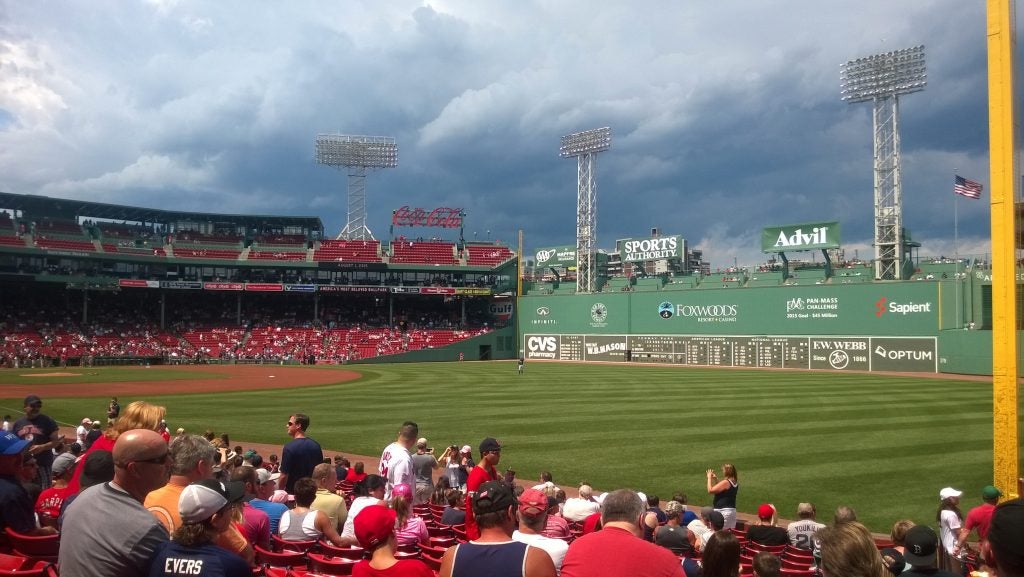
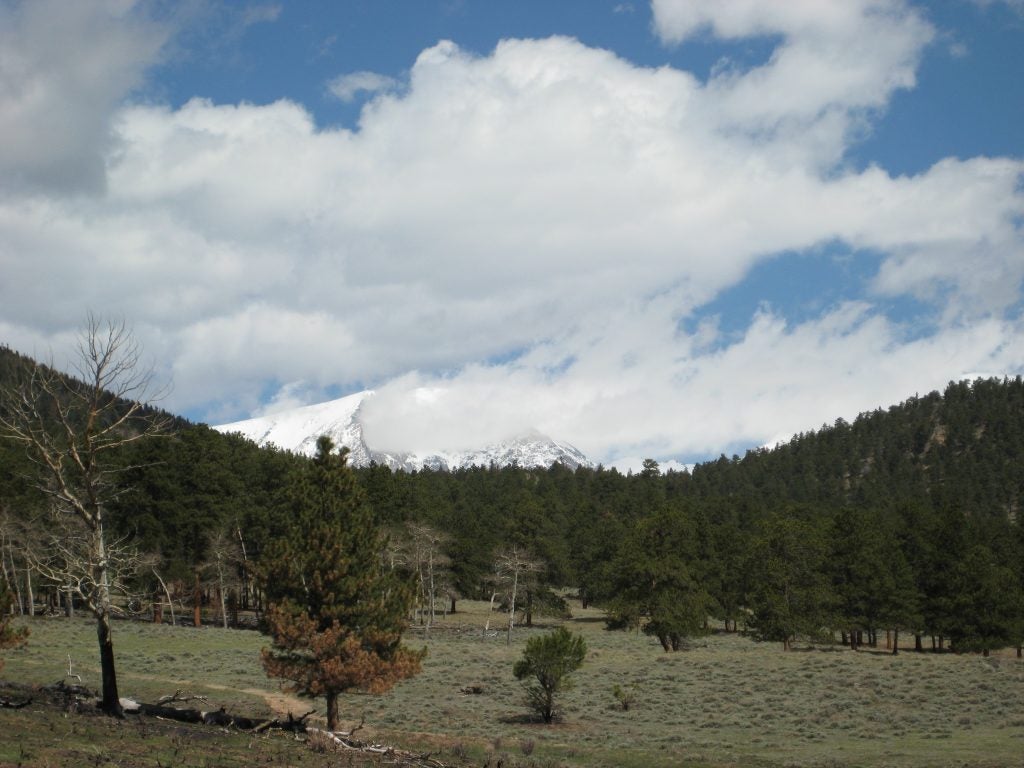
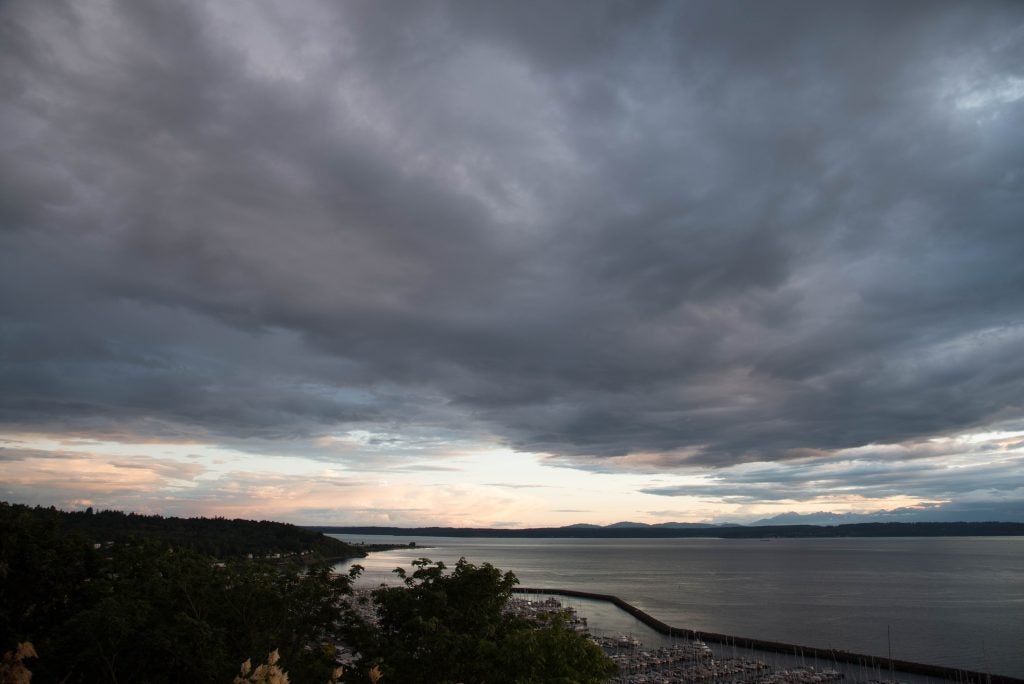
*We’ve missed you in your absence.
That’s it. As of this morning, grades have been submitted for the spring quarter. It was a very strange year, and an especially strange quarter of ATM 111. I’m looking forward to teaching full time in the classroom again in the fall. Join me for ATM 250 to learn about clouds, wind, fronts, and all those weathery things we deem sub-synoptic.
As any of my students will tell you, I am a life-long Atlanta Braves fan. And as any Braves fan will tell you, the ultimate Brave was Hank Aaron. Whether you think he is still the rightful homerun champion or not (he is), his records that impresses me the most are that he had 80 more RBI thank Babe Ruth (for the all-time lead) and an incredible 700 more Total Bases than Stan Musial (also for the all-time lead by over 10%!). As a fan who watches a lot of games, it was also incredible to hear his stories in interviews of growing up and eventually playing professionally in the South. He was a man who faced adversity but never let it stand in his way. It’s a shame the team couldn’t give Aaron one last World Series in 2020. It’s no longer Hammer Time.

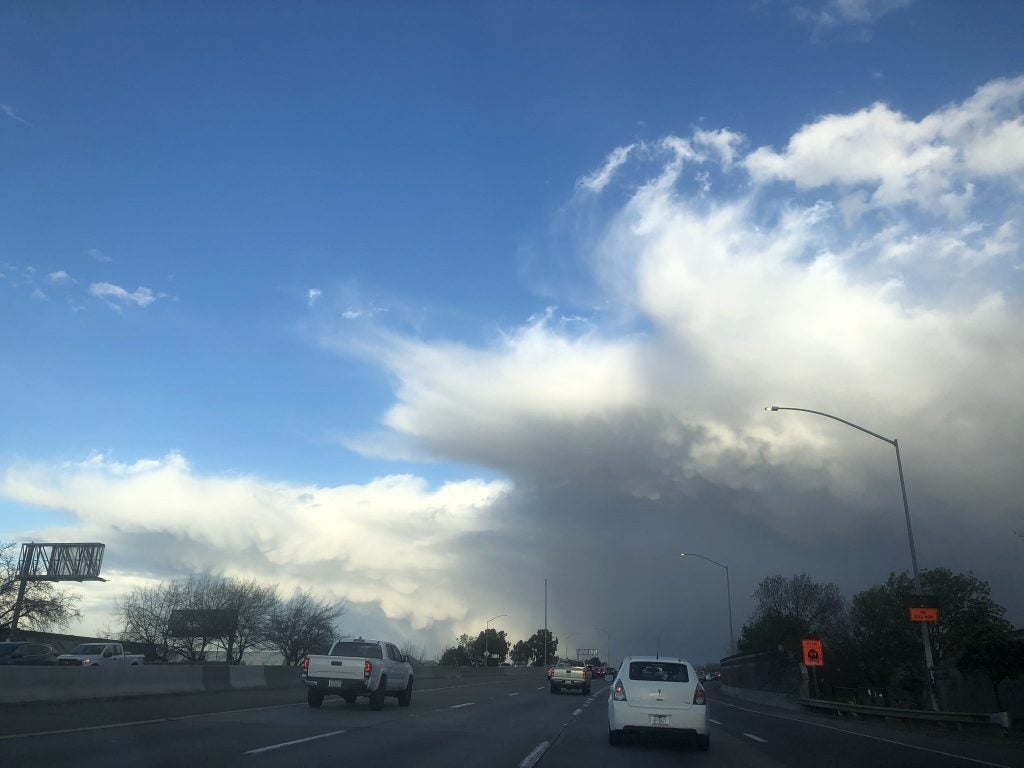
Rainfall patterns will always amaze me. Here is the CoCoRaHS map of Davis from this morning (i.e. data from 7am 11/17 to 7am 11/18). The consistency of the rainfall gradient you see in that map suggests to me that this is truly indicative of a nearly doubling of received rainfall from the northwest to the southeast of town, rather than just measurement uncertainty. The greatest distance between any two points on the map is probably about 2 miles. How, then, does one forecast precipitation for Davis if the possible real, physical range of outcomes is a factor of 2? Are our models considered a success if they get one of those values correct? Or the mean? Or, some scaled mean? I don’t know.

Here’s a plain language summary for my NCT/DoNUT paper (see previous post): https://link.growkudos.com/1jo23qce77k . I’m linking to this not because my plain language summary is very exciting or particularly good but because I appreciate the intention of Kudos. I think the average person on the street is very excited by the process of science and genuine scientific discoveries even if he is also fatigued by science driven policy impacting his life.
Also, the title is a Simpsons quotation, just because.
UC Davis has another team of stellar forecasters attacking the WxChallenge (https://www.wxchallenge.com/) again this year. Go Aggies.

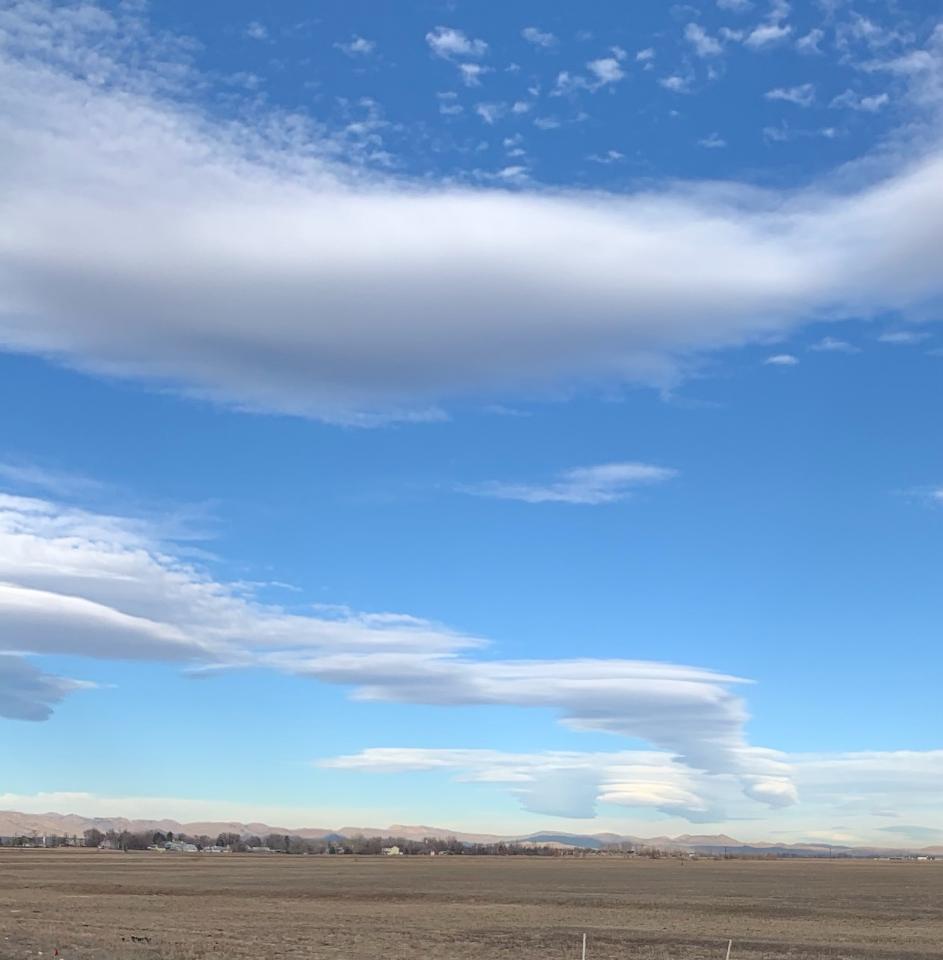
I’m very proud of this one. Check out our newest paper published in EOR in JAS below. The paper introduces two concepts. The first is whether or not convective clouds and circulations care about the Cosine terms of the Coriolis Force that we almost always forget about. The short answer is that they do. The Cosine terms systematically tilt convection toward the west. The implications of this are many (future papers), but in the simplest possible sense, clouds care because they are no longer symmetric at the equator. When viewed from space, Equatorial clouds are not round! The second is that this paper introduces our new (genuinely inter-disciplinary) conceptual model of convection: the Dynamics of Non-rotating Updraft Torii or “DoNUT” model (the name actually gives away that our development is incomplete so far). Rather than imagining convection as a plume, we envision convection as a 3D torus. Doing so allows us to draw some pretty fundamental insights into convection. We can connect rising and sinking air associated with convective clouds directly. And, you’ll see in the paper that connection matters. Here too, more papers to come.
I mention in the acknowledgements that my consideration of the Cosine Coriolis terms was inspired by several ATM 121A (atmospheric dynamics) classes I have taught recently. This paper would not exist if I hadn’t had some great students in my classes over the years. We also acknowledge a colleague whose recent passing inspired us to keep pushing (cooking?) the DoNUT.
Being on parental leave has given me the opportunity to catch up with Sesame Street after 30 years. In a recent episode, I learned that Bert has always dreamed of being a TV weatherman. Well, I’m here to be the first to officially invite Bert, and any prospective students who have always dreamed of forecasting the weather for a living, to apply to the UC Davis atmospheric science major. With a little hard work in our atmospheric science classes, Bert, I know you can get over your stage fright and forecast the weather with confidence!

July 6th marks the first day of my family leave over the summer. I will be checking email and Twitter but much less frequently than usual. If you’re awaiting a slow reply to contact, entertain yourself with the newest UCD Cloud Library additions.
Davis has not seen any precipitation this month and will not see any tomorrow. The rumor is that this will be our first ever rain-free February. I looked back through the 50 years of data I’ve used for a couple of these recent posts, and sure enough, in those 50 years, every previous February has seen precipitation. The remarkable thing about our rain-free February in 2020 is just how much of an outlier this is. Not only have all previous Februarys seen rain, but the previous minimum number of rainy days in February is 7!
Warning: This is terrible use of statistics! The climatological probability of precipitation for February days in 36% (i.e. it rains about 1 in every 3 days normally). Given the 36% likelihood of precipitation on any given day, the likelihood of a rain-free February is just 1 in 229,688 (i.e. (1-.36)28). If that February has 29 days (like 2020), the likelihood drops to 1 in 356,951. So, it’s significantly less likely a leap year would have a rain-free February, not just a little less likely as may be intuitive. Of course, to do this calculation well, I really need a lot more data and some way of accounting for the autocorrelation of precipitation…
As a fun check of the data I do have: Februarys with 28 days have an average monthly rainfall of 3.50” and Februarys with 29days have an average monthly rainfall of 3.67”, or almost exactly 1/28 more. Cool.


© 2026 Matt Igel
Theme by Anders Noren — Up ↑