The extreme heat in the US southwest in March made national news for 2 weeks, so I’m not breaking a story here. But, I wanted to point out some things from the Sacramento climate report for the month that I think are remarkable.
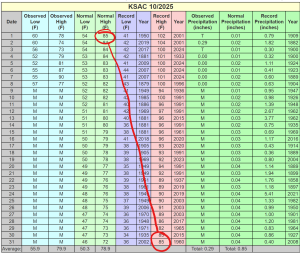
- [Middle lines] We set high temperature records on ten consecutive days! Plus, we set two more. That means that 1/3 of all high temperature records were set in a single year. There was a bit of “luck” in there to be sure, but it’s still wild. As a fun bonus, the red lines make an exclamation point.
- [Left-most lines] The mean high for the month was +12F over the normal mean.
- [Right-most Line] Not only did we receive merely 5% of our mean precipitation, but also it all came on the very last day of the month. So, we were less than 24 hours from receiving no rainfall for the entire month of March, one of only five months in which we may normally reasonably expect significant rainfall.