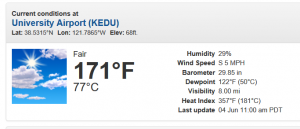
The thermometer at the UC Davis airport went a little crazy earlier today. It was reading a temperature of 171F. That’s clearly an error, but check out the heat index: 357F! That’s pretty meaningless.
I’ve never actually taken a look at the heat index equation, although it’s clearly some kind of empirical relationship. https://en.wikipedia.org/wiki/Heat_index . OK, so in temperature, it’s some constants, a linear term, and an squared term. It must be those squared terms that are doing the trick. Below, I plotted up the heat index between 80F and 175F (blue line) at 40% humidity (which apparently is the lowest limit for humidity in the equation???).
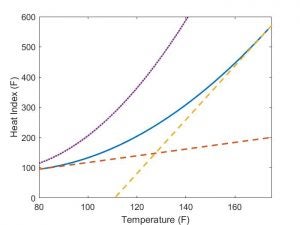
First, good thing it wasn’t 40% humidity or we would have had a heat index of over 500F earlier — makes 350F seem almost tolerable. Second, we see the issue with using empirical equations here. Empirical equations are often trained on easily measured data but applied beyond those ranges either unknowingly or by design. At these temperature scales, the red dashed line, a linear version of the full equation at low temperature, would probably be a better estimate of the true heat index. Also, just for comparison, the purple line is computed with a relative humidity of 80%. It’s over 1000F for a dry temperature of 175F.