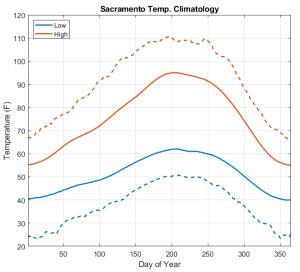
So, I want to talk a little bit about Sacramento temperature climatology. This first figure below is what you might expect to see when thinking about temperature statistics: “normal” lows and highs; and “record” lows and highs. These will feel familiar to anyone who lives in the Central Valley. We have mild winters with little diurnal range and rather warm record lows. We have what you might consider a long spring with slowly increasing normal highs and lows. We have a very hot summer followed by quickly cooling normal and record temperatures in fall. What I’m showing below is actually the 10-day running mean of temperatures. This helps smooth out all the bumps and wiggles in the data.
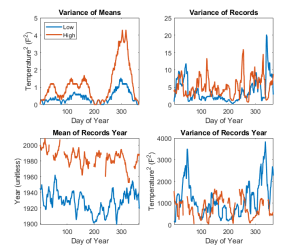
But, what I really want to talk about is the variance of the normal and record temperatures. Below, I’ve included a figure with 4 panels. The first is the 10-day running variance (or variability) of the normal temperatures. Since normals are locally monotonic (in time), this panel shows us how quickly the normal high and low change. As we might have inferred from above, normal highs vary at 10-day time scales more than normal lows and do so most strongly toward the end of the year. Interestingly, the second panel (the 10-day variance of the records) doesn’t look at all like the first panel. The variance in record high temperatures is wiggly but functionally constant across the year. This is not what I expected. I had imagined the record highs would vary strongly in the summer and weakly in the winter. The variance of the record low peaks in the cold season and is near zero around day 225 (mid-August).
On the bottom row, I have plotted 1) the 10-day running mean of the year of the record high and low (gaps occur when the same record is set in multiple years) and 2) the 10-day variance of the year of records. Here, we see an obvious global warming signal — much more recent mean years of high temperature records than low. The average difference is 56 years! That’s incredible. Also noteworthy: the 10-day mean year of record high decreases throughout the year. I have no idea what to make of that — Our winters are more record warm than our falls? The 10-day variance of the year of records is also a bit surprising. Here, we see peaks in record low occurrence year in the cold season. It seems (from this figure and looking at the raw data) that in the winter, we’ve actually had lots of instances of contemporary record lows even if on average they primarily occurred prior to 1940.