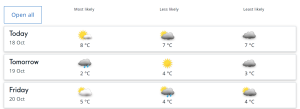
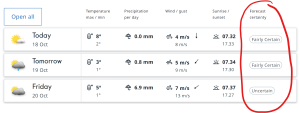
The group is excited to announce new funding from the National Science Foundation to help us better understand the dynamics of convective circulations.
Author: migel (Page 2 of 7)
This post is just a link to a University article. That’s all. Click and enjoy. https://www.ucdavis.edu/majors/blog/13-majors-help-you-combat-climate-change
The scariest things in life can be those that are imagined rather than seen. Science, in a way, is the process of taking the seen and making it not-scary through understanding and explanation. But, what of the unseen? Too often in physical science we conflate the unseen with the impossible. Take the quotation below that I ran across today which, in effect, I have heard uttered many times from physical scientists:
“We didn’t think it was possible because we had never seen it before.” (quotation I have altered to anonymize)
This kind of reasoning frustrates me continually. Science is fantastic at observing the physical world but simultaneously fantastically poor. We can be lulled to sleep by our considerable skills. In 2022, data pours in to scientists in deluges. We have so much data that we don’t know what to do with it all. Despite this, there are (at least) two reasons we might never have observed something possible. 1) Rare events happen rarely. 2) We might not be looking. So, rather than being lulled to sleep by our data richness, I think we should consider the value in being rousted by our collective naivety.
The scientific enterprise is grounded by observations. That grounding prevents people like me, who may otherwise be so inclined, from living in an imagined world. But, having failed to observe something in the past is not the same thing as its being impossible or even, necessarily, uncommon. Science requires us to be looking (and indeed it compels us to look) in order to test an idea. A lack of observations should not preclude all attempts to consider that which is consistent with existing knowledge.
If it does, then Lisa Simpson has a Tiger-Repelling Rock to sell us all. Unseen tigers are scary.
It has been an incredibly foggy autumn here in Davis (and throughout much of the CA Central Valley). I made a histogram of daily rainfall totals from the past 50 days of my Cocorahs gauge. I’ve grouped totals into 0″ (clear, cloudy, or light fog), 0.01″-0.02″ (heavy fog), and >=0.03″ (rain). So far this autumn, over half of our days have seen measurable precipitation but 60% of those days have been from fog-fall rather from rainfall.
*We’ve missed you in your absence.
That’s it. As of this morning, grades have been submitted for the spring quarter. It was a very strange year, and an especially strange quarter of ATM 111. I’m looking forward to teaching full time in the classroom again in the fall. Join me for ATM 250 to learn about clouds, wind, fronts, and all those weathery things we deem sub-synoptic.
As any of my students will tell you, I am a life-long Atlanta Braves fan. And as any Braves fan will tell you, the ultimate Brave was Hank Aaron. Whether you think he is still the rightful homerun champion or not (he is), his records that impresses me the most are that he had 80 more RBI thank Babe Ruth (for the all-time lead) and an incredible 700 more Total Bases than Stan Musial (also for the all-time lead by over 10%!). As a fan who watches a lot of games, it was also incredible to hear his stories in interviews of growing up and eventually playing professionally in the South. He was a man who faced adversity but never let it stand in his way. It’s a shame the team couldn’t give Aaron one last World Series in 2020. It’s no longer Hammer Time.
Rainfall patterns will always amaze me. Here is the CoCoRaHS map of Davis from this morning (i.e. data from 7am 11/17 to 7am 11/18). The consistency of the rainfall gradient you see in that map suggests to me that this is truly indicative of a nearly doubling of received rainfall from the northwest to the southeast of town, rather than just measurement uncertainty. The greatest distance between any two points on the map is probably about 2 miles. How, then, does one forecast precipitation for Davis if the possible real, physical range of outcomes is a factor of 2? Are our models considered a success if they get one of those values correct? Or the mean? Or, some scaled mean? I don’t know.
Here’s a plain language summary for my NCT/DoNUT paper (see previous post): https://link.growkudos.com/1jo23qce77k . I’m linking to this not because my plain language summary is very exciting or particularly good but because I appreciate the intention of Kudos. I think the average person on the street is very excited by the process of science and genuine scientific discoveries even if he is also fatigued by science driven policy impacting his life.
Also, the title is a Simpsons quotation, just because.
UC Davis has another team of stellar forecasters attacking the WxChallenge (https://www.wxchallenge.com/) again this year. Go Aggies.